Debug tools
Show what a game is doing while it plays: readings in a panel over the screen and lines over the scene, each set turned on by name with one launch flag, and costing nothing when it is off.
module: awake:core:diagnostics
module: awake:world
module: awake:scene:physics
module: awake:navigation
module: awake:ai
Vulkan
WebGPU
Desktop · Android · iOS · Web
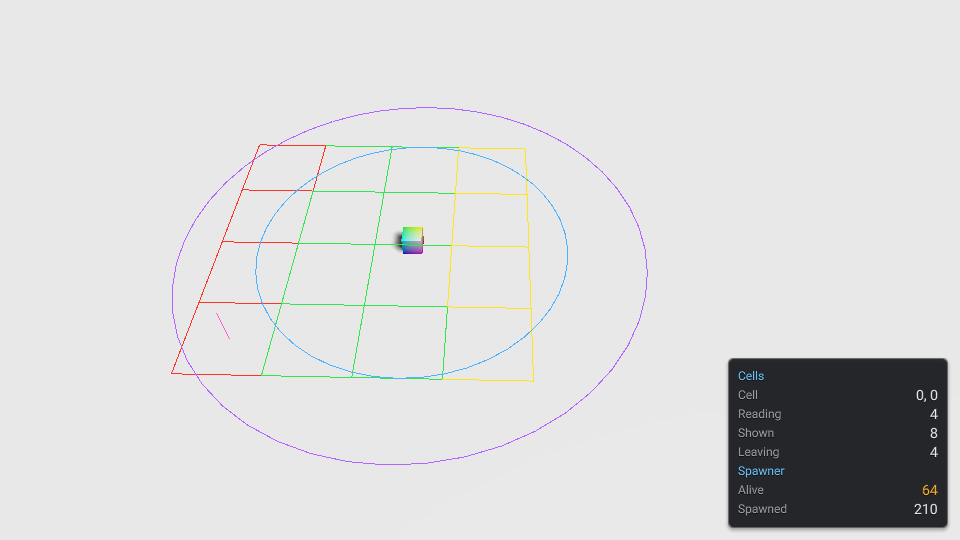
cells and spawner sources on, rendered by the engine. The short pink line on the left is the spawner source's post, drawn by SpawnerDebugSource.lines below.Sources and probes
A probe is a set of plain counters that a system keeps up to date every frame, whether or not anyone is looking: how many enemies are alive, which cells are loading. A test asserts on the probe.
A debug source is a view of a probe. It has an id, which is what turns it on, a title, and two
methods: rows writes readings for the panel, and lines writes world-space lines to draw over the
scene. A source measures nothing itself, so turning it on or off never changes what its probe counts.
DebugSource, DebugRows, DebugLines, DebugRegistry and DebugFlags are in
awake:core:diagnostics, which depends on the math and colour modules only. A source written against
it depends on nothing that draws, so it can sit next to the system it reports on.
Write a source
Start with the probe. The system owns it and writes it as it works:
// What a spawner counts, whether or not anyone is looking: its probe. The spawner writes it every frame.
class SpawnerProbe {
    var alive = 0
    var spawned = 0
    val spawnPoint = Vec3f(0f, 0f, 0f)
}
The source reads the probe. Each row is a label and a number or text; warn = true shows the value
in amber. Each line is two points and a colour:
/** The spawner on the debug panel and over the scene: `--debug=spawner`. */
class SpawnerDebugSource(private val probe: SpawnerProbe) : DebugSource {
    override val id = "spawner"
    override val title = "Spawner"

    // Reused for every line: the host copies the points, so drawing allocates nothing.
    private val a = Vec3f(0f, 0f, 0f)
    private val b = Vec3f(0f, 0f, 0f)

    override fun rows(out: DebugRows) {
        out.row("Alive", probe.alive, warn = probe.alive > MAX_ALIVE)
        out.row("Spawned", probe.spawned)
    }

    override fun lines(out: DebugLines) {
        // A post two metres tall at the spawn point.
        val at = probe.spawnPoint
        a.set(at.x, at.y, at.z)
        b.set(at.x, at.y + 2f, at.z)
        out.line(a, b, POST)
    }

    private companion object {
        const val MAX_ALIVE = 50
        val POST = Color(1f, 0.4f, 0.8f) // a constant: a Color made per line would allocate
    }
}
- Keep it allocation-free. The host copies the two points of every line, so reuse a pair of
scratch
Vec3fs rather than making new ones, and keep eachColorin a constant. Pass the sameStringto a text row while its value is unchanged; the panel only re-renders a row whose value changed. - Keep it short. The panel has 16 rows by default, a source's title included. Rows past the last one are dropped.
Vec3f()is(1, 1, 1), not zero. WriteVec3f(0f, 0f, 0f)for a scratch point.
Turn sources on
A DebugRegistry holds the sources a game has and the ids that are on. Build it from the launch
flags: --debug=cells,spawner on desktop, ?debug=cells,spawner on the web.
val desktop = DebugRegistry(DebugFlags.fromArgs(listOf("--debug=cells,spawner")))
val web = DebugRegistry(DebugFlags.fromPage { name -> if (name == "debug") "cells" else null })
On the web, pass the page's query parameter to fromPage, for example
DebugFlags.fromPage(browserLaunchParameters()::first) (see
Launch parameters). Ids are trimmed, lower-cased and split on commas, and a
repeated flag adds to the set.
Then register the registry as an app service, and the sources with it:
fun debugTools(registry: DebugRegistry, spawner: SpawnerProbe): AwakeAppLifecycle = app {
    // A scene on the default infrastructure systems draws the lines and the panel of every source that is on.
    service(DebugRegistry::class, registry)
    scene("debug-tools") {
        val cells = frameSystem("cells") {
            WorldPartitionSystem(WorldPartitionConfig(cellSize = 4f, loadingRadius = 8f, unloadRadius = 12f))
        }
        onReady {
            // Off unless `cells` is in the flags: an off source is never added, so it costs nothing.
            registry.register(WorldPartitionDebugSource(system(cells).probe))
            registry.register(SpawnerDebugSource(spawner))
            world.scene {
                entity("camera") { camera(lens = Lens.perspective(eye = Vec3f(0f, 24f, 18f), center = Vec3f(0f, 0f, 0f))) }
                entity("player") {
                    transform()
                    with(StreamObserver) // cells stream, and are drawn, around this entity
                }
            }
        }
    }
}
service(DebugRegistry::class, registry) is all a scene on the default infrastructure systems needs:
DebugVisualizationSystem draws the lines of every source that is on, and DebugPanelSystem shows
their rows. Hold one registry for the whole game. register returns a function that takes the source
out again; call it when the system the source reports on goes away.
The panel and the lines
The panel sits in the bottom right of the screen, over the game's own HUD. Each source that is on
shows its title in blue on a row of its own, then its rows: a label on the left, a value on the
right, a warning in amber. It reads the sources ten times a second and writes only the rows whose
values changed. DebugPanelStyle sets the number of rows, the corner it is pinned to, its offsets,
width and draw order, and debugPanelPrefab(style) is the panel as a prefab an editor can open.
The lines draw in the same call as the scene's other debug lines (the WorldDebugSettings toggles,
such as bounds and frustums), so neither set wipes out the other. They draw over the scene, never
hidden by it, and the renderer takes at most 65,536 lines a frame; any past that are dropped.
The world partition source
WorldPartitionSystem keeps a probe, a WorldPartitionProbe, of what it streams: the observer,
the cell it is in, and each active cell with its state. WorldPartitionDebugSource shows it, with
the id cells:
| Row | What it counts |
|---|---|
| Cell | The observer's cell, as x, z, or -- with no observer. |
| Reading | Active cells whose load is still in flight: their content isn't in the world yet. |
| Shown | Active cells loaded and within loadingRadius. |
| Leaving | Active cells loaded but past loadingRadius, kept only by the band up to unloadRadius: the next to go. |
| Line | Colour |
|---|---|
| A Reading cell's outline | Yellow (WorldPartitionDebugSource.READING) |
| A Shown cell's outline | Green (SHOWN) |
| A Leaving cell's outline | Red (LEAVING) |
| The loading radius, a circle of 48 lines around the observer | Blue (LOAD) |
| The unloading radius, a circle of 48 lines | Violet (UNLOAD) |
The lines lie flat 0.15 m over the observer's height, so they follow the player across the ground.
Tag the player with StreamObserver, as Large worlds recommends: a camera's own
height would show them edge on. Under a floating origin, cells are counted in absolute space and
drawn where the world currently is. A cell only reads when the system has an
asyncStreamListener and a loadScope; with a frame-thread listener every cell loads at once.
Visualization toggles from the flag
The WorldDebugSettings toggles answer to the same flag, so a game can turn them on without adding
the component in code: --debug=bounds,grid on desktop, ?debug=bounds,grid on the web. The
default systems' DebugVisualizationSystem turns them on once in each world it runs, adding a
WorldDebugSettings when the world has none; after that a debug panel can still turn them off.
| Id | Turns on |
|---|---|
bounds |
Each mesh's bounds |
instance-bounds |
Each static instance's bounds |
occluders |
Occluder boxes |
lights |
Light gizmos |
shadow-frustum |
The shadow cascades' volumes |
grid |
The ground grid |
axes |
The X, Y and Z axis lines |
skeleton |
Each animated skin's bones |
wireframe |
Triangle edges over opaque meshes |
view-<name> |
A shader view, its RenderDebugView name in kebab case: view-world-normals, view-linear-depth, view-shadow-visibility, view-albedo, view-clay |
The camera frustum has no id, because it needs a target camera; the culling source draws the
frozen culling camera's frustum. DebugToggleIds holds the ids.
The sight source
PerceptionDebugSource shows what each Perceiver sees, hears and remembers, with the id sight.
Give it the world and the same PerceptionSpace the PerceptionSystem was made with, so it draws
from where the system looks:
| Row | What it counts |
|---|---|
| Perceivers | Entities with a Perceiver. |
| In sight | Entities the perceivers see now, summed over them. |
| Remembered | Entities the perceivers remember, in sight or not. |
| Heard | Perceivers that remember a noise. |
| Line | Colour |
|---|---|
The focus cone: two edge rays out to focusRange and an arc of 16 lines joining them |
Amber (PerceptionDebugSource.FOCUS) |
The peripheral cone, the same out to peripheralRange |
Blue (PERIPHERAL) |
| The hearing range for a sound of loudness 1, a circle of 32 lines | Dim violet (HEARING) |
| From the eye to each remembered entity's last known position, with a small cross there | Red (IN_SIGHT) when it is in sight now, grey (REMEMBERED) when it is only remembered |
| A cross where the remembered noise came from | Dim violet (HEARING) |
The cones lie flat at the perceiver's eye, eyeHeight over its position, so they show from above
the sight the system tests in three dimensions. A cone of 360 degrees is a full circle. A perceiver
with no facing sees with its peripheral cone all round and not with its focus cone, so it shows a
peripheral circle and no focus cone. Attack and aggro ranges are a game's rules, not perception's:
a game draws them with a source of its own, registered the same way.
The physics source
PhysicsDebugSource(world), in awake:scene:physics, shows the physics bodies of a World, with the
id physics:
| Row | What it counts |
|---|---|
| Static, Dynamic, Kinematic | PhysicsBody components with each motion type. |
| Sensors | Bodies that are sensors (triggers). |
| Unbuilt | Bodies with no backing body yet, in amber when it isn't 0. A body is built the next time PhysicsSystem runs, so one that stays unbuilt has no PhysicsWorld. |
Its lines are each collider at its entity's Transform, the same ones physicsDebugLines(world)
returns: a box's 12 edges, three rings of 16 lines for a sphere, two rings and five lines for a capsule,
a heightfield's footprint at its lowest sample, and the box around a mesh's or convex hull's points.
Static bodies are blue (PhysicsDebugSource.STATIC), dynamic ones green (DYNAMIC) and kinematic ones
amber (KINEMATIC). The source only walks the bodies: each shape is drawn by PhysicsShapeWireframe, in
awake:physics:api, which writes one PhysicsShape at a position and rotation into any DebugLines and
needs no scene.
The navigation source
NavDebugSource, in awake:navigation, shows a navigation grid and the routes agents walk on it, with
the id nav. Make it over one baked NavGridTile or over a StreamedNavGrid:
val ground = NavGroundHeight { x, z -> heightmap.heightAtWorld(x, z).let { if (it.isNaN()) 0f else it } }
registry.register(NavDebugSource(streamedGrid, ground) { routes })
ground lays the lines on the terrain; NavGroundHeight.FLAT, the default, is level ground at y = 0.
The last argument returns the routes to draw, as AgentRoutes. The navigation module can't see who
walks a route, so the game keeps one list and changes it when a route changes; the source reads it
once a frame.
| Row | What it counts |
|---|---|
| Cells | Resident cells of a streamed grid. A single tile has no such row. |
| Walkable | Navigation samples an agent can stand on, over every resident cell. |
| Blocked | Samples an agent can't stand on. |
| Routes | Agents whose route has at least one point. |
| Line | Colour |
|---|---|
| A cross on each blocked sample, 0.05 m over the ground | Red (BLOCKED_COLOR); on a streamed grid, alternating with orange (BLOCKED_COLOR_ALTERNATE) by cell, so a tile placed at the wrong cell breaks the pattern |
| Each resident cell's outline, 8 lines an edge so it follows the ground | Blue |
| Each route, 0.35 m over the ground, ending in a larger cross on its goal | One of ROUTE_COLORS, picked by the agent's entity id |
They are the lines navGridDebugLines returns for the same grid and routes. A streamed grid's cells
are read again only after a tile loads or unloads.
The culling source
A scene app on the default systems turns culling into lines with the id culling: no
registration needed beyond its DebugRegistry service. RenderSystem3D then records, into a
CullingProbe, what culling decided for every mesh with MeshBounds, and CullingDebugSource
draws each one's world box in the colour of that decision.
| Row | What it counts |
|---|---|
| drawn | Meshes in the camera's view and not hidden: drawn. |
| outside view | Meshes outside the camera's view. |
| occluded | Meshes in view but behind an Occluder. |
| shadow only | Meshes the camera rejected that are still drawn into the shadow maps. |
| not culled (instanced) | Copies of InstancedMeshRenderer and InstancedSkinnedMeshRenderer meshes, drawn every frame without being culled. Only shown above 0. |
| frozen (F9) | Whether culling is frozen. |
| boxes not shown | Meshes past CullingProbe.maxBoxes (4096): counted, not drawn. Only shown above 0. |
| Line | Colour |
|---|---|
| A drawn mesh's box | Green (CullingDebugSource.DRAWN) |
| An outside-view mesh's box | Grey (OUTSIDE_VIEW) |
| An occluded mesh's box | Red (OCCLUDED) |
| A shadow-only mesh's box | Violet (SHADOW_ONLY) |
| A copy of an instanced mesh, which is never culled | Cyan (NOT_CULLED) |
| The frozen view's frustum, its far plane at most 60 m out | Yellow (FROZEN_VIEW) |
F9 freezes culling. Culling keeps the camera it had at that moment while the scene still draws
from the live one, so you can fly out and see what the frozen view kept (green) and dropped (grey
and red). Press F9 again to thaw. In code, set CullingProbe.frozen.
Outside the default systems, give a render system the probe yourself:
val probe = CullingProbe()
renderSystem.cullingProbe = probe
registry.register(CullingDebugSource(probe))
A mesh without MeshBounds is never culled, so it has no box. Culled meshes aren't drawn at all, so
the boxes, not the meshes, show what was dropped.
Zero cost when off
- A source whose id is not in the flags is never added to the registry, so no host ever calls it.
- With no source on, the panel is never made and the line host draws nothing it didn't before.
- The probe is written every frame either way: the counters cost a few array writes per active cell, and allocate nothing once its arrays have grown to the most cells that were ever active.
- A source that is on allocates nothing in a steady frame:
DebugLineBufferreuses each line's segment from the frame before, and the panel rebuilds a row's text only when its number changed.
With no renderer, headless or on a server, the hosts do nothing and the probes still count.
See also
- Large worlds for
WorldPartitionSystemand its radii. - Physics for bodies, shapes and
PhysicsSystem. - Navigation for baking a grid and streaming it.
- Launch parameters for reading flags on every platform.
- Game UI for the canvas the panel is drawn on.